Seamount and aseismic ridge subduction correlates with enhanced forearc deformation, backarc thrusting, subduction erosion, gaps in the volcanic arc, changes in slab dip angle, along trench changes in seismicity patterns, and variation in seismic coupling characteristics. These apparent relationships are observed where ridges/seamount chains project into affected margins, but direct observations of the fate of these features and the mechanisms by which they affect the overriding plate are difficult to make and are rare in the literature. We propose to investigate the continental margin off central Chile where the Juan Fernandez aseismic ridge is currently subducting. Here there is a clear gap in the volcanic arc extending from the ridge-trench intersection northward for 500 km. In the more localized region defined by the ~150 km swath of ridge subduction there is enhanced seismicity relative to the areas 400 km to the north or south, and unusual deformation of the forearc is manifested by the Valparaiso basin, one of only a few significant basins along the margin. In July, 1995 the German marine research institute GEOMAR conducted a seismic experiment in this area using ocean bottom hydrophones (OBHs) and an airgun seismic source to acquire wide-angle seismic refraction/reflection data along two 2D profiles and in an 85 kmx85 km 3D grid. Along with scientists from GEOMAR, Chile, Spain, Denmark, and the United States, Zelt was involved in the survey design and data acquisition. Here we propose to use these data to determine 2D and 3D velocity structure in this critical section of the margin, and in particular, to assess the influence of seamount subduction on the margin structure. A key aspect of the proposed research is to use 3D seismic tomography to detect any subducted seamount currently beneath the continental margin and to map out its dimensions and morphology. This information, combined with available swath bathymetry, potential field data, and seismic reflection data, could provide rare, direct evidence for the effects of subducted seamounts. This effort will be complemented with direct imaging (migration) of reflected arrivals recorded by the OBHs along the 2D profiles.
The primary goal of the proposed research is to obtain detailed 2D and 3D velocity models of the continental margin. In the first order, these models are expected to indicate the presence or absence of a subducted seamount beneath the continental margin. In addition, the velocity models combined with the available seismic reflection and other data will be used in the following investigations: (i) Delineate the shape and velocity structure of the accretionary wedge. This will lead to estimates of its porosity, indicate its degree of dewatering, and suggest gross fluid flux across the margin. (ii) Examine the geometry and formation of the Valparaiso Basin-is its presence related to a subducted seamount currently beneath the margin? (iii) If a subducted seamount is identified, what is its spatial relationship to the 1985 (7.8 magnitude) earthquake and its pattern of rupture? (iv) Estimate the dip of the shallow subducting plate and use this, if possible, to constrain its elastic parameters. (iv) Use the velocities for improved migration of the reflection data, for migration of reflected arrivals in the 2D OBH data, and for earthquake relocation.
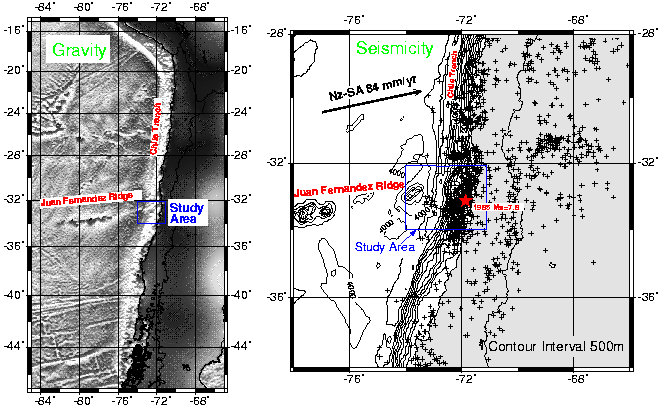
Free-air gravity map shows the Chilean margin and the Juan Fernandez ridge intersecting the Chile Trench in the study area. Seismicity map for the period 1980-1994 shows enhanced activity where the Juan Fernandez ridge projects beneath the margin. 92% of the source depths (NEIC) within the study area are < 65 km. Plate motion vector from NUVEL-1 model.

2D and 3D wide-angle OBH data were collected in 1995 during SONNE cruise 103. Numbered symbols are OBH locations.
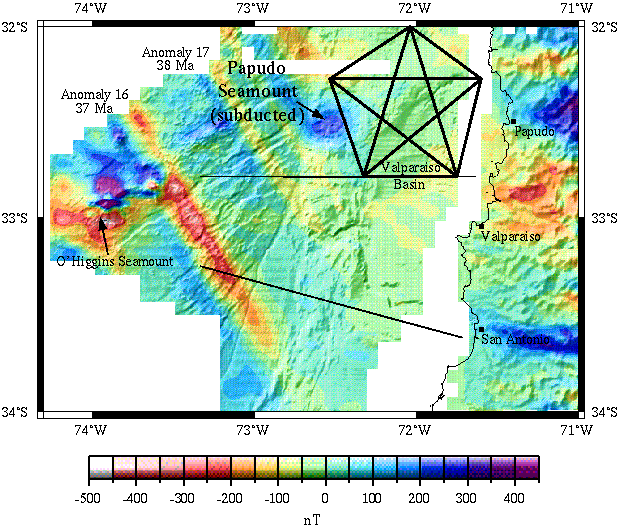
The illumination of the magnetic data using the bathymetry shows the subducted Papudo seamount (von Huene et al., 1997).
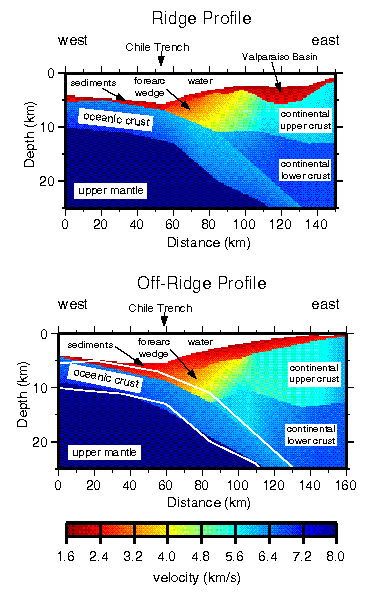
Preliminary 2D velocity models.

Ray coverage for ridge profile.
Results of 3D tomographic inversion
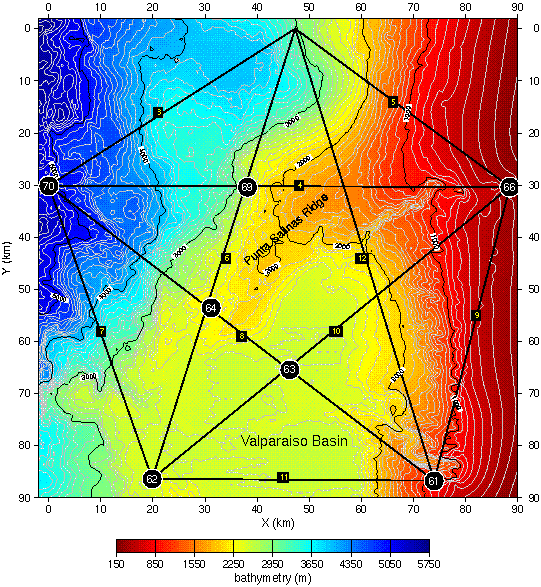
The seven OBHs from which the 3D data were obtained and the 10 airgun profiles are labeled. Contour interval for bathymetry is 100 m.
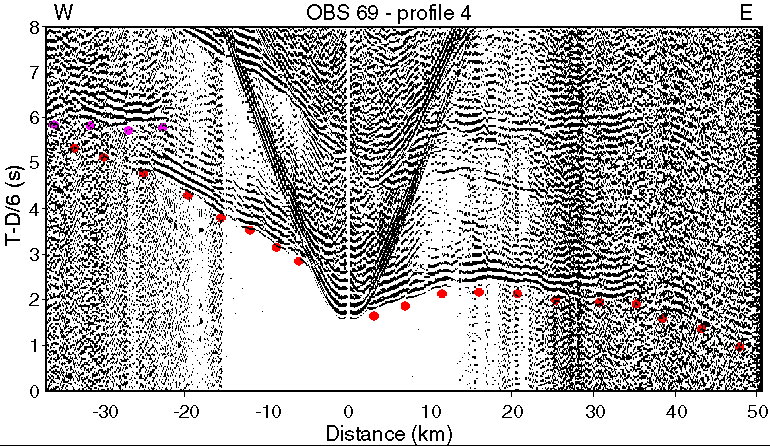
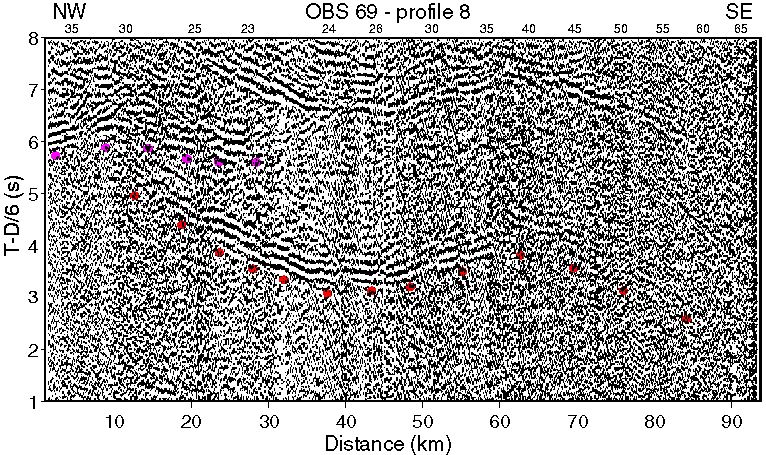
Examples of in-line (top) and off-line (bottom) data for OBH 69, profiles 4 and 8. First arrivals and reflections from the base of the subducted oceanic crust indicated by red and pink dots, respectively. In-line data plotted versus source-receiver offset; off-line data plotted versus distance from the NW end of profile 8; offset values indicated above data. Data are reduced using 6 km/s and bandpass filtered between 2-15 Hz.
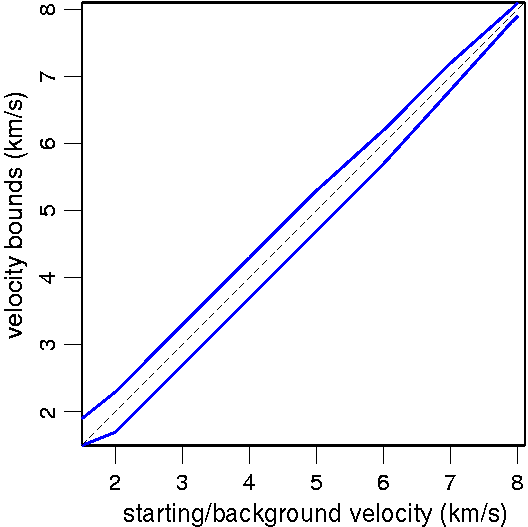
Bounds with respect to the starting 3D velocity model were imposed by "clipping" the velocity values at each iteration according to the limits indicated by the blue lines.
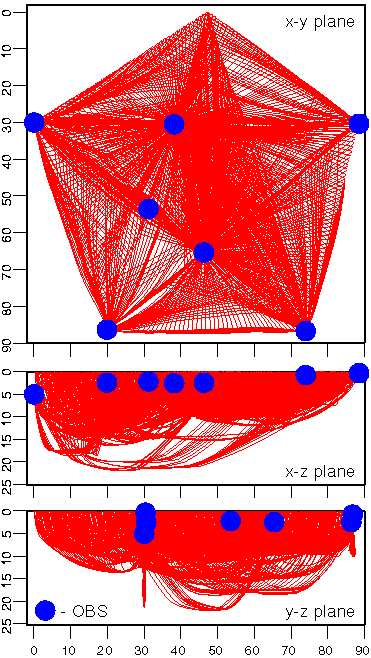
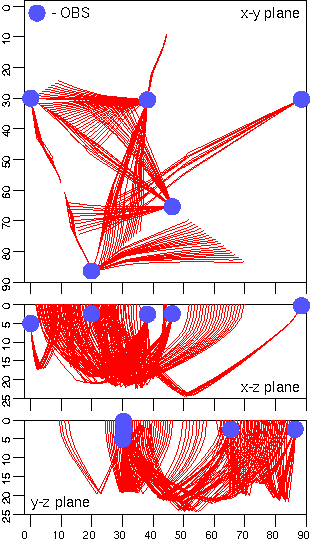
Every 10th raypath is shown for the first arrivals projected into the x-y, x-z, and y-z planes as labeled.
Every 10th raypath is shown for the reflected arrivals from the base of the subducted oceanic crust projected into the x-y, x-z, and y-z planes as labeled.
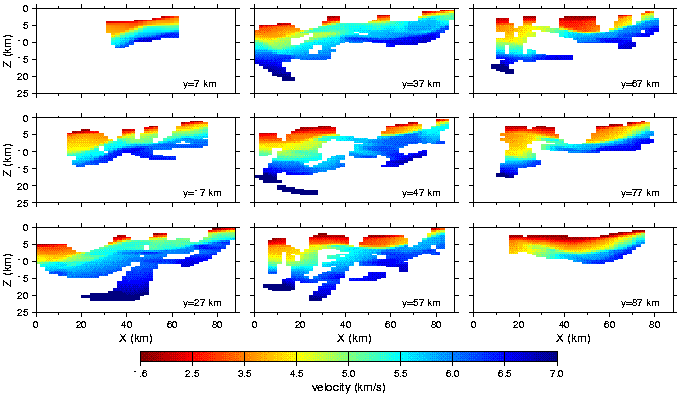
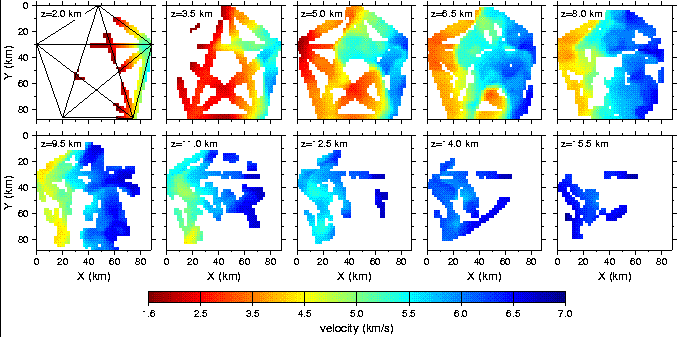
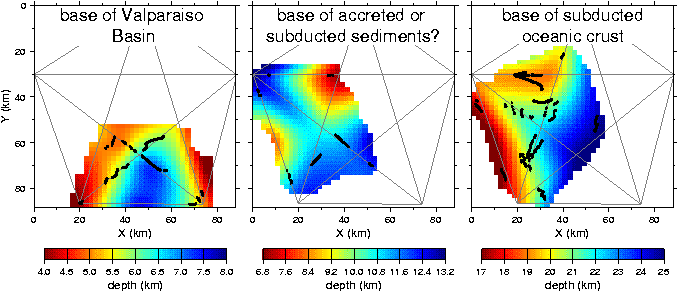
Final 3D velocity and interface model. Unsampled regions of the model have been omitted. The positions of the vertical and horizontal slices are labeled in each plot. Black dots indicate the reflecting points for each interface.
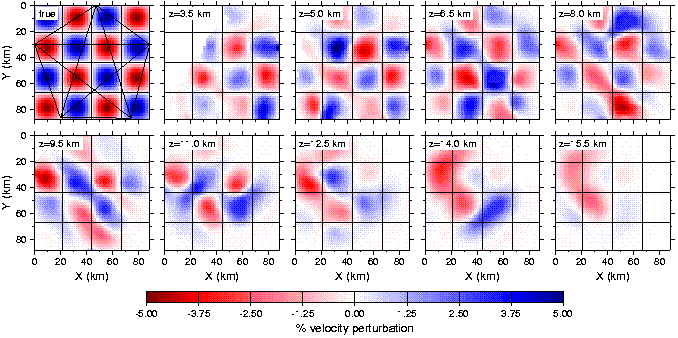
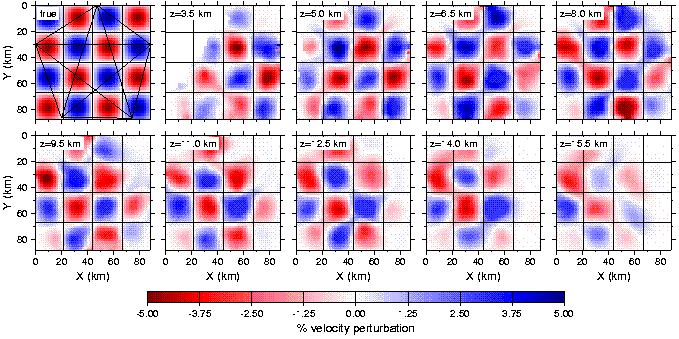
Synthetic data calculated from a checkerboard model consisting of the 3D background model with a 5% laterally-alternating anomaly pattern superimposed were inverted using the source-receiver geometry and noise level of the real (picked) data (above), and the ideal data with 50 ms noise assuming 100% data recovery from all 10 OBH's deployed (below). The recovered anomaly patterns in each case are shown as horizonatal slices at the depths labeled; the true anomaly pattern is shown as the top left horizontal slice.
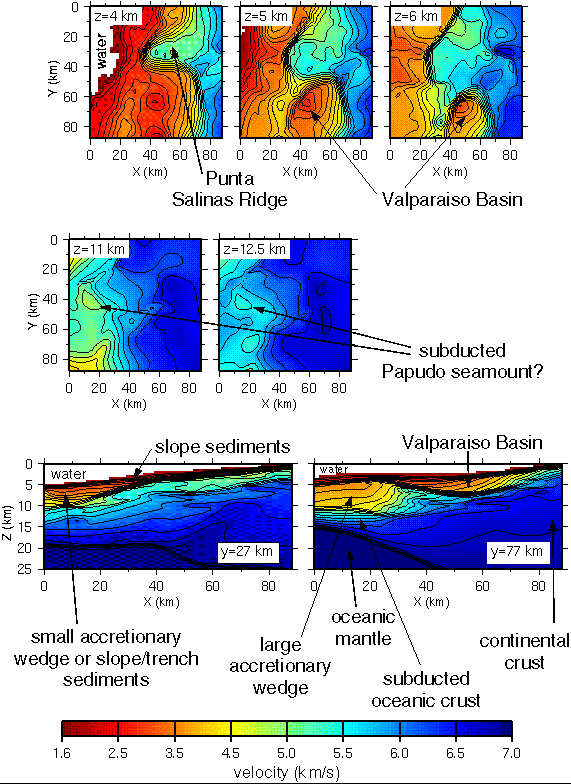
Correlation of 3D velocity model with large-scale geologic features. Five depth slices and two vertical slices at the positions as labeled are shown.