Synthetic Example #1
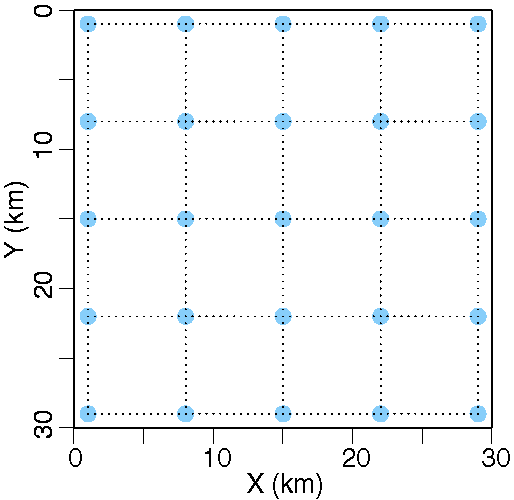
Fig. 1. Experimental geometry for both synthetic examples showing OBSs (blue circles) and shots (black dots).
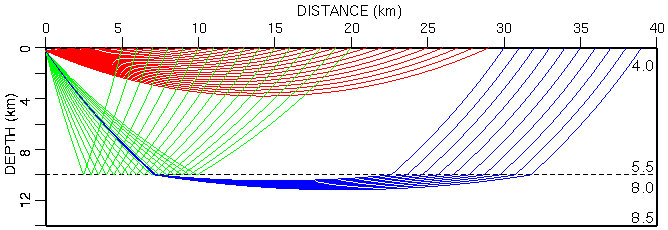
Fig. 2. Raypaths for first synthetic example through 1D background model. Velocities (km/s) indicated inside the model on right side. Note gap in turning ray coverage between 4-10 km depth.
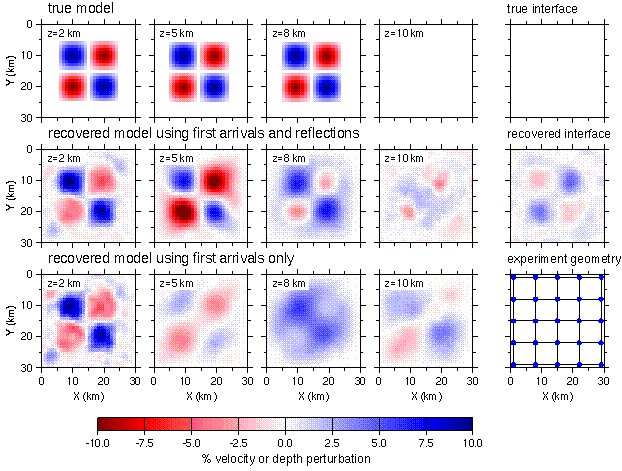
Fig. 3. Four horizontal slices at the depths labeled are shown through the true model (top), the recovered model using both first arrivals and reflections (middle) and the recovered model using only first arrivals (bottom). The true and recovered interface are also shown to the right of the upper two models. The velocity and interfaces are presented as relative perturbations with respect to the background model. Note: (1) the improved imaging of the high and low velocity anomalies at 5 and 8 km depth when using both arrival types, and (2) this improved imaging is at the expense of a small perturbation (up to 4%) in the recovered interface.
Synthetic Example #2
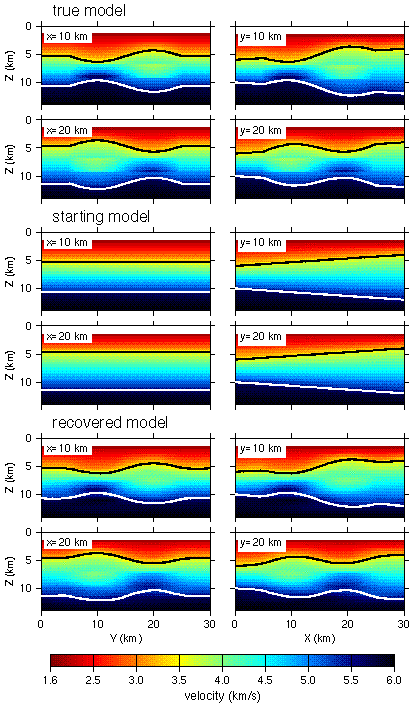
Fig. 4. Four vertical slices at the positions labeled through the true, starting, and recovered models and the two interfaces for each model indicated by black and while lines.
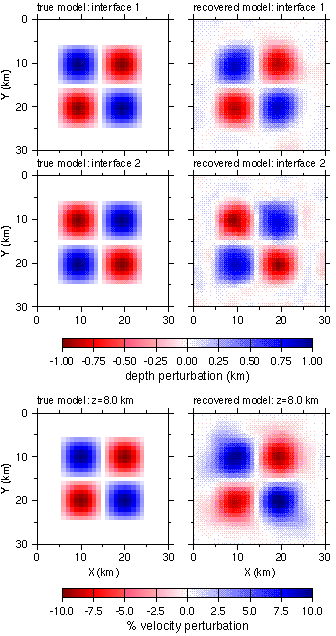
Fig. 5. The true and recovered interfaces and velocity anomalies shown as perturbations with respect to the starting/background model. The velocity perturbations are shown for 8 km depth, which is the center of the 3.5 km thick anomalies.
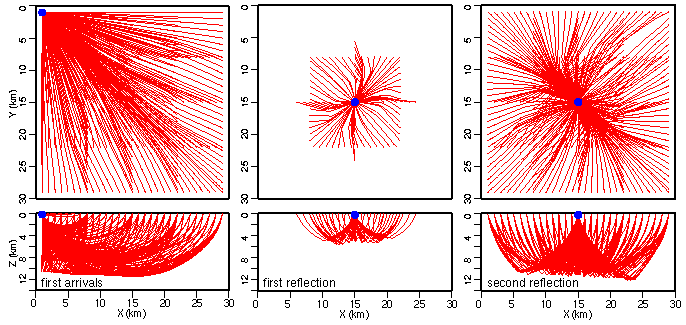
Fig. 6. First arrival and reflected raypaths through the final model for a single OBS (blue dot) in the corner of the model (for first arrivals) and in the middle of the array (for reflections). For clarity, every second raypath is shown.
3D seismic reflection tomography
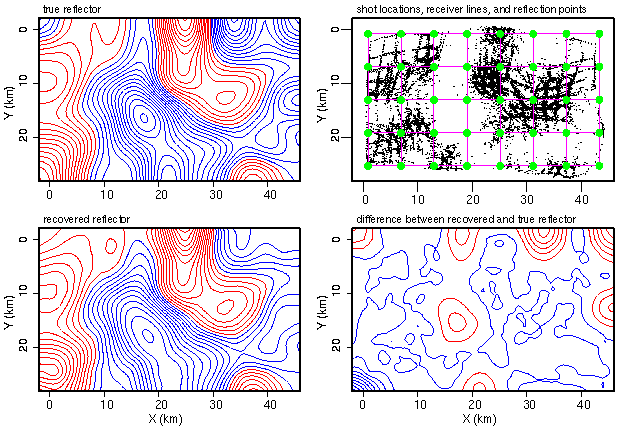
Fig. 7. Example of 3-D reflection tomography. Velocities above reflector are assumed known (5 km/s at the surface and a linear velocity gradient with depth of 0.07 km/s/km). The true reflector is between 7.4-13.1 km depth, and the starting reflector was flat at 10.5 km depth. The true and recovered reflectors are shown as perturbations relative to 10.5 km depth; contour interval is 0.2 km (red negative; blue positive) Shots (green dots) and receivers arrays (pink lines) are shown together with the reflection points for the recovered reflector. Regularized inversion with smoothness constrains was used to invert the 11,756 synthetic data; 25 ms of Gaussian noise was added to the traveltimes from the known model. Only data with less 25 km source-receiver offset were used.