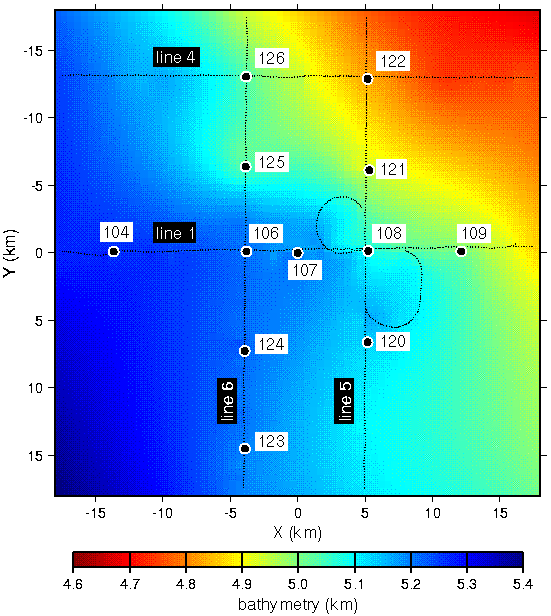

Fig. 10. The 12 OBS/OBHs and shots along lines 1, 4, 5 and 6 used to invert for 3D velocity structure above and below the S reflector. All shots were recorded into all receivers.
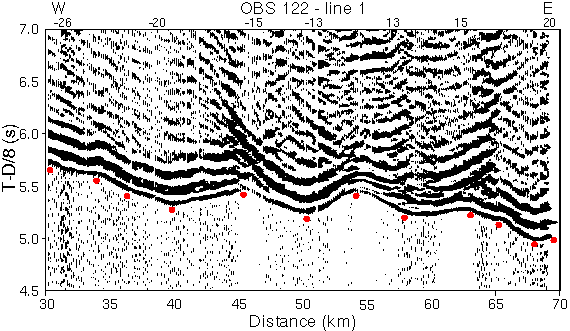
Fig. 11. Example of off-line OBS data recorded into line 1. First arrivals indicated by red dots. Data reduced using 8 km/s and trace normalized. Horizontal scale represents distance from the west end of line 1; source-receiver offset values (km) indicated above data.

Fig. 12. The complete set of first arrival picks used to invert for 3D velocity structure plotted versus source-receiver offset and reduced using 8 km/s. Excluding direct (water wave) arrivals, there are about 17,000 picks. The final 3D model fits these data with an RMS residual of 50 ms.
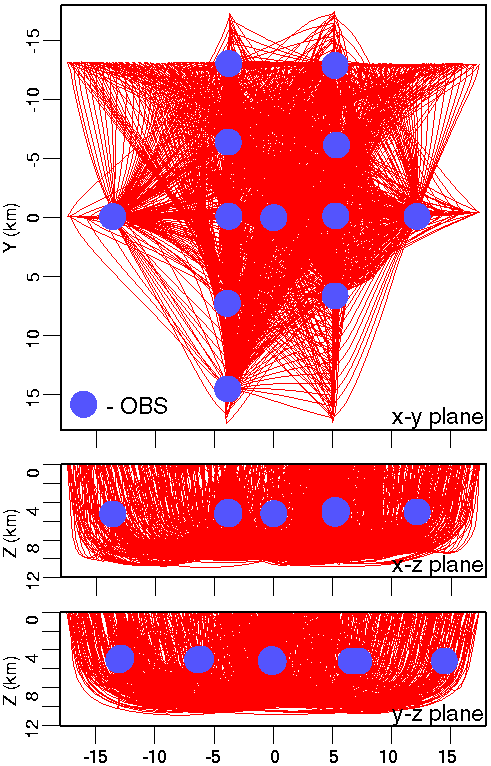
Fig. 13. Every 10th raypath through the final 3D velocity model projected into the x-y, x-z and y-z planes.
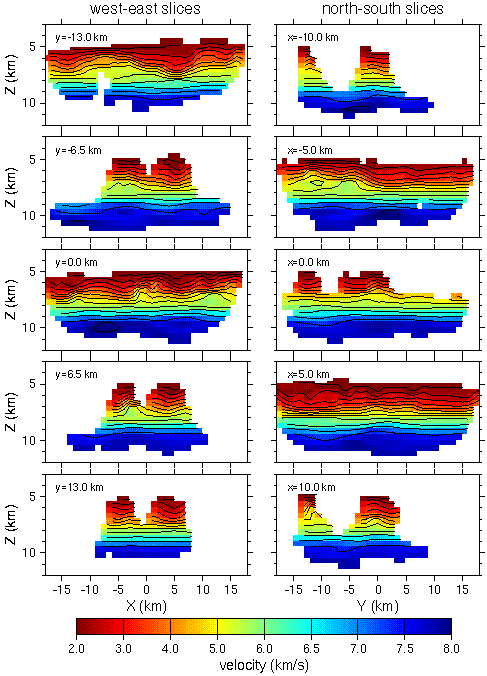
Fig. 14. Vertical x and y slices through the 3D velocity model at the positions labeled in each plot Contour interval is 0.5 km/s. Unconstrained regions of the model have been omitted.
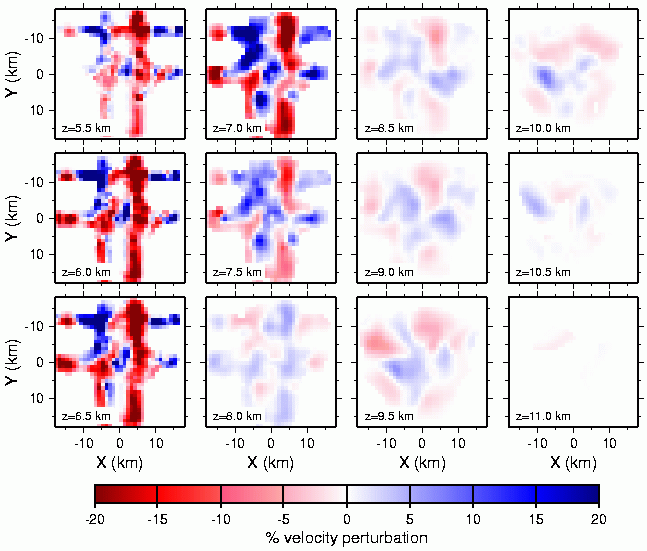
Fig. 15. Horizontal slices through the 3D velocity model at the positions labeled in each plot. Unconstrained regions of the model have been omitted. Relative perturbations from the 1D starting model are shown. The regularized inversion allowed more variation above 7.5 km.
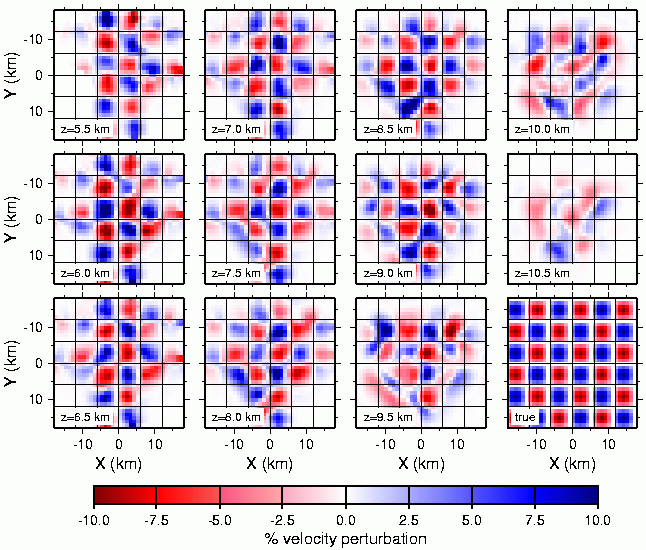
Fig. 16. Results of a checkerboard resolution test using the source-receiver geometry of the picked data. The true anomaly pattern is shown as the lower right plot. Unconstrained regions of the model have been omitted. Relative perturbations from the 1D starting model are shown.
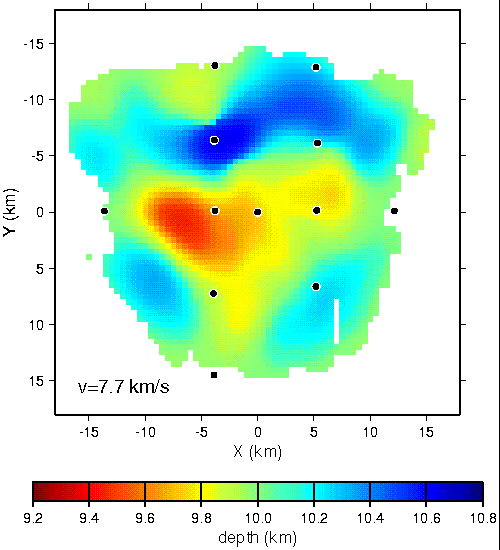
Fig. 17. Depth to the 7.7 km/s surface in the final 3D velocity model that is interpreted to represent the S reflector and/or moho based on the 2D models and the MCS data. The OBS/OBH locations are indicated (Fig. 10).